Jul
23
U.S. Climate Data Is Mostly Corrupt
“[T]he rate of warming as measured by unperturbed surface stations, USCRN, and UAH does not represent a climate crisis.” — Corrupted Climate Stations: The Official U.S. Temperature Record Remains Fatally Flawed (2022)
Have you ever wondered how the climate gurus calculate things like average surface temperatures and warming trends? Where do they get the data?
The answer is… volunteers. Well, that’s just part of the answer. The authoritative U.S. agency in charge is the National Oceanic and Atmospheric Administration (NOAA), which in turn has a division named the National Weather Service (NWS). The NWS has installed thousands of surface stations — Maximum Minimum Temperature Systems (MMTS) housing Nimbus digital thermometers — all around the country. Readings are gathered from these surface stations by 8500+ volunteers collectively called the Cooperative Observer Network (COOP), who report the data back to the NWS.
“COOP data usually consist of daily maximum and minimum temperatures, snowfall, snow depth, and 24-hour precipitation totals. Observations may include additional hydrological or meteorological data such as evaporation or soil temperatures.”
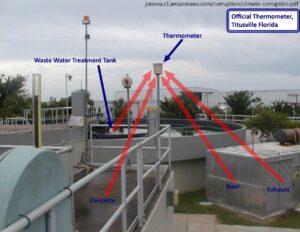
In 2009, a study by Anthony Watts et al. used a subset of the COOP network called the United States Historical Climatology Network (USHCN) — 1,225 stations out of the network’s 8,700 stations — as a representative sample of the entire system. The report identified many problems, including 1) the fact that many stations were located on or near heat-sinks (e.g., sidewalks, rooftops, brick walls, parking lots), A/C exhaust fans, or waste-water treatment plants (WWTPs); data gaps due to the human element in recording/reporting the data; questionable methods for “infilling” missing data; lack of proper maintenance; etc. Approximately 90 percent of the USHCN stations failed to meet the NWS’s own siting requirements for what is “acceptable”.
The peer-reviewed paper was published and distributed to thousands of lawmakers, scholars, and scientists. The story was covered by news outlets and social media, as well. Some of the worst USHCN stations were then closed, and some of those were relocated. Scientists at the National Climatic Data Center (NCDC) issued a response that tried to largely dismiss the 2009 study’s conclusions. But, Watts and his team issued additional papers (2011, 2015) that strengthened their case even further. Another study published in 2016 found that the heat-sink problem was getting worse. Then, researchers at NOAA’s Atmospheric Turbulence and Diffusion Laboratory in Oak Ridge, Tennessee, published the results from a 2019 study in the Bulletin of the American Meteorological Society, which “vindicated the findings of the original 2009 Surface Stations publication as well as Watts et al.’s 2015 follow-up.”
Meanwhile, NOAA was forced to abandon the USHCN dataset in 2014 in favor of a new one called “nClimDiv”. This dataset incorporates 10,000+ installations from the “nClimGrid” network, which includes the USHCN stations plus thousands of stations from the Global Historical Climatology Network (GHCN). They also debuted the new U.S. Climate Reference Network (USCRN), which supposedly “measures temperature with superior accuracy and continuity in places that land-use change will not likely impact during the next five decades. Built specifically for this purpose, it is unlike any other climate observation network in the United States.” But, for some reason, USCRN data isn’t used or cited in public reports.
“Instead, they use nClimDiv data, which contains all of the poorly sited USHCN stations, in addition to thousands of other stations that likely have the same set of station siting problems. NOAA / NCDC claims they then ‘adjust’ the nClimDiv data to closely match the data from the USCRN. This ‘Band-Aid’ approach does little to address problems that have been identified, and instead creates a dataset rife with multitudes of adjustments that may or may not fairly represent long-term temperature trends. Moreover, this approach does not address problems with individual station records, such as heat sink effects and biased temperature readings.
Furthermore, adjusting the nClimDiv data to closely match the data from the USCRN only affects 17 years of data, failing to address any data produced before USCRN became operational in 2005. This means all of the temperature data showing climate warming in the 20th century was not adjusted in the same manner as data gathered after 2005, creating a disjointed U.S. climate dataset.”
This is what prompted Watts and the Heartland Institute to do another study on the issue — i.e., the 2022 Surface Stations Survey. They photographically reviewed as many of the USHCN stations cited in the original 2009 survey as possible (80), noting any differences between then and now. They also took a photographic survey of 48 GHCN stations to determine if they have the same type of problems that plagued the USHCN. They considered “station continuity data” for the GHCN stations, as well. “The overall sample is broadly representative of the entire network, as it samples stations in the majority of states.” (Note: If you’re curious, the 2022 report includes many photos of sample stations, including before-and-after pics where applicable.)
A few highlights from the findings…
o The 2009 report found 89 percent of stations were unacceptable by NOAA’s own standards. The 2022 report found an even greater percentage of stations — approximately 96 percent (123 out of 128) — are sited unacceptably.
o In some interviews with observers, it became clear NOAA / NWS personnel are aware their station siting does not adhere to NOAA standards, but they do not have the means or the time to take corrective action.
o Based on the 2022 survey sample, it appears that record continuity has been given more importance than accuracy. Even though many stations’ sensor locations clearly violate standards, they were placed in sub-optimal locations regardless.
o Lack of station maintenance was observed throughout the USHCN and GHCN. MMTS sensors were often discolored/yellowed, dirty, and in the case of WWTP placements, often covered in mold. This results in a lower reflectivity albedo and biases temperature readings higher due to increased absorption of sunlight during the day.
o Oddly, rainfall values at all COOP stations are reported to the nearest tenth of an inch, whereas temperature is reported to the nearest whole degree.
o There is very little oversight of the COOP Network by NOAA / NWS, and the data are entirely dependent on the skill of the volunteer observers.
o Section 515 of Public Law 106-554, known as the Information Quality Act (IQA), provides guidelines for the reliability and accuracy of data produced by government agencies. NOAA has acknowledged the IQA, but given the 96% compromise rate, plus the fact that unperturbed stations do not show the same level of warming as stations not in compliance, it is clear that NOAA is producing data that is not in compliance with IQA.
“It is important to note Watts and his fellow authors found a slight warming trend when examining temperature data from unperturbed stations, which cleaved closely to the findings of the University of Alabama-Huntsville’s (UAH) satellite-derived temperature record. This warming trend, however, is approximately half the claimed rate of increase promoted by many in the climate science community.”
In essence, the 2022 study found a lot more of what it found back in 2009, and in some cases it was even worse. Also, “despite NOAA’s assertions to the contrary, climatic temperature increases as measured by nClimDiv cannot be effectively isolated from potential confounds such as heat sinks, urbanization, WWTPs, population growth, and other factors.” H. Sterling Burnett, director of the Arthur B. Robinson Center on Climate and Environment Policy at The Heartland Institute, concludes:
“This new study is evidence of two things. First, the government is either inept or stubbornly refuses to learn from its mistakes for political reasons. Second, the government’s official temperature record can’t be trusted. It reflects a clear urban heat bias effect, not national temperature trends.”
The U.S. temperature record is supposed to be “the best in the world.” Makes you wonder how badly corrupt the surface station readings are in the rest of the world, too, doesn’t it?